Great business intelligence with Chartio

A couple of weeks ago, I shared our story of looking for the right Business Intelligence tool and gave some advice on how to evaluate BI tools. This is an exciting time to be looking for a new BI tool because there are so many exciting options in the BI landscape. But it’s a pretty crowded landscape, and you will quickly go from “the world-is-my-oyster” to “I can’t-see-the-forest-for-the-trees”. Not only that, but when you start evaluating digital products, you will find yourself inundated with sales calls.
To do the research on BI tools, I got pretty deep in the weeds, but there were a few products that really stood out.
One of the products at top of our BI tool short list is Chartio (pronounced chart-ee-OH). Chartio is a bit of disruptor in a landscape that’s currently dominated by big players like Tableau and Pentaho. A little googling reveals that Chartio’s founder, Dave Fowler, is one of those 30-under-30 brainiac types (aren’t we all though?), and this isn’t surprising. When you use Chartio, you definitely get a sense of the cleverness underneath it. Speaking from a UX point of view, the cleverest thing you can do is take something that is vastly complex (like a database) and turn it into something that looks simple (like a colourful dashboard).
We don’t often write reviews here on the blog. We are simply strong believers in using the right tool for the right job at the right time. And I’ll tell you, the quest for a great BI tool is not an easy one. Finding reputable and credible reviews of BI tools is a challenge. It’s one thing to look for something like a photo editing tool or a scrum board tool; you’ll find lots of advice comparing features, prices and performance. But looking for the same kind of thing for BI tools? The advice isn’t easy to find, which is why we’re sharing our knowledge here.
We’ve done some legwork in our quest for the right tool to fit with Wicket and want to share some of our findings with you to help you on your path to better business intelligence.
What we like
Free trial and easy onboarding
This is crucial. Learning the terminology and features of the BI landscape is challenging enough, you don’t want any more pain-points. Long onboarding process? “Free” trials that require a credit card? Make my phone number a required field for a free trial and then CALL me seconds later to give me a sales pitch? That’s a deal breaker ladies. Let me kick the tires in peace for a few days first, please.

Chartio’s free trial is truly free (no credit card required) and they don’t hassle you with phone calls. Just a couple of polite emails.
Support
Not sure how to use the tool? You have questions about licensing? Interested in advanced features? The Sales team at Chartio was responsive, courteous, and relaxed. They hopped on a screen share meeting with me right away, at my request, to answer my questions about features and pricing, and to show me how to use it (all in a soothing California accent).
Intuitive
Chartio’s claim that half of their new users are up and running within a week seems credible. No BI tool will be without a learning curve, but Chartio is certainly one of the more intuitive products we evaluated. The interface is clean, the support documents are written in plain language, and the demo charts give you a great starting point.
Drag and drop
We’ve tried enough BI tools to know that some of them, although they have some drag and drop, still require you to get involved with SQL. But a must-have for our evaluation is that the BI tool must have true drag and drop for users who don’t know how to write SQL queries. Chartio truly lets you create drag and drop queries with hassle-free joins between tables; you can even turn off the SQL tab altogether if you want.
SQL too
While drag and drop is a must-have, you may already have SQL queries ready to go. Or maybe you’re a SQL nerd like yours-truly. In that case, you’ll want to communicate with your data in SQL. Chartio lets you go back and forth between drag and drop and SQL without hassle.
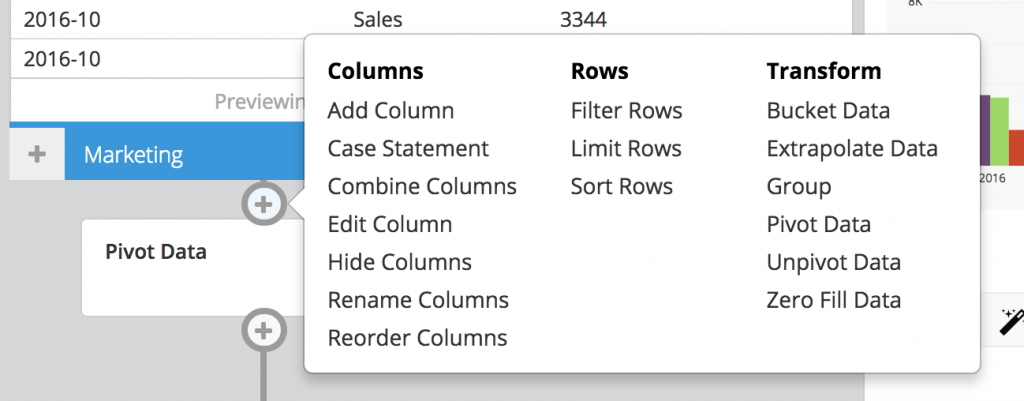
Pipeline
Oh, the pipeline. In my opinion, the data pipeline is the secret sauce of Chartio. In the data pipeline, you can merge, layer, and transform your queries. Pivot data, change the order of columns, add calculated columns, and more; the pipeline lets you take your queries to a sophisticated level of intelligence, and all with drag and drop. For example, connect your sales database and your site analytics to Chart, then merge them in the data pipeline, so you can analyze the correlation between website traffic and sales.
Dashboards
Visualizing data can be extremely powerful. A dashboard of visual charts can be a compelling way to communicate business intelligence. But you don’t want to get bogged down fussing with alignment and appearance. Chartio does a great job with their WYSIWYG dashboard builder. You can move, resize, add, and duplicate charts easily. A grid baseline in your dashboard means that all your charts line up neatly and automagically.
Another nice touch is the ability to switch dashboard themes. Go from light and corporate to dark and colourful in a few seconds.
Scheduled reports
This is a great feature that lets you send a pdf of the dashboard out to a list of email addresses, automatically, on a schedule. Choose your time and between Daily, Weekly or Monthly.
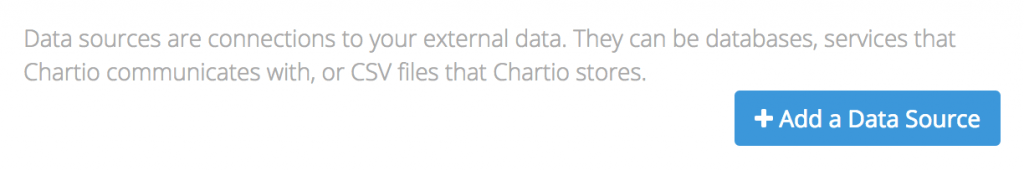
Connect your data
It’s as easy as a friendly blue button that says Add your data source. And then, if the data connection process starts getting a bit technical, you have the option of inviting a database admin. Enter their email and they’ll get an invite to Chartio and they’ll finish the data connection.
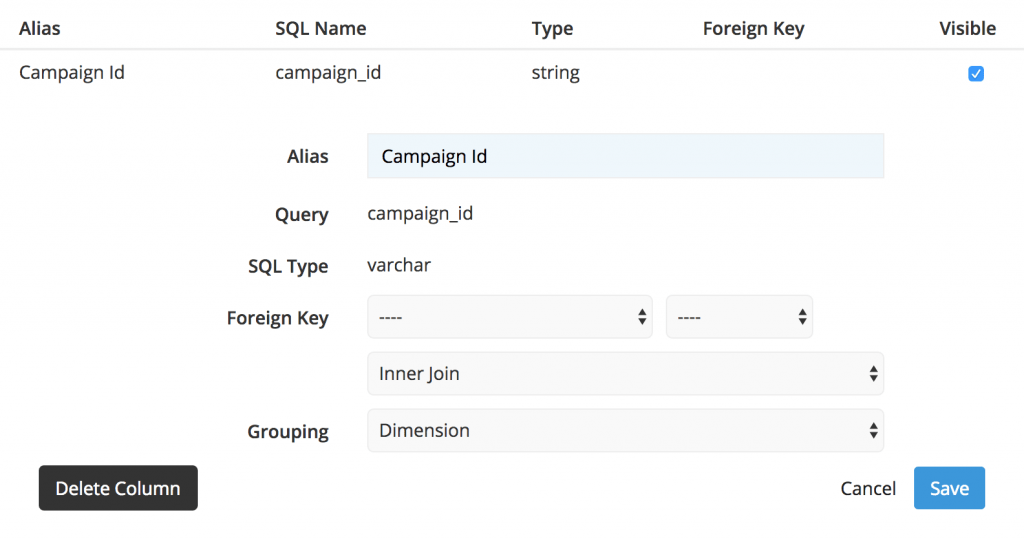
Tailor your schema for humans
Have a complex database with a structure that looks like spaghetti? Have a lot of fields with names made for robots? No problem. With Chartio you can tailor the aliases of your data schema to be in plain language that you and your staff will understand. Tired of report headers like pmt_method_id, langcode, o_id, u_id? There are good reasons for the terseness of database field names, so you don’t want to change the underlying database definitions. Chartio lets you tailor the aliases of your fields to make the visiblelayer of the data more user-friendly. So in your report, you will see Payment Method, not pmt_method_id, and Language, not langcode.
What more would we like to see?
Multi select
When we’re building a report, it would save time to be able to select multiple fields and drop them into a query. Some of our more complicated sales reports for Wicket, for example, have a lot of columns pulled from the same table. I would like to grab them all in bulk and drop them into the query builder.
Switch data sources on the fly
We’d like the ability of being able to switch the data source of a chart, or even better, of a whole dashboard. There are dashboards that we create using a test data source. We’d like to switch them from test to production data without editing the data connection itself.
Custom styles
I’d like to see the ability to customize the dashboard styles a little more. Nothing major, but it would be nice to have the ability to drop in a logo or choose a on-brand font.
Flexible pricing
Do you ever feel that SaaS pricing is designed for the small organization or the very large organization, but not really for the organizations in between? Most services seem to be going this way, whether it’s big guys like Atlassian or little startups. You end up in a weird purgatory of pricing that’s not quite right. Not small enough for the intro price, but not really big enough for the mega pricing. Chartio recently added Team licenses, which is great for multiple teams of report makers. What we’d love to see is more flexibility in Chartio For All license, but designed for small to medium sized organizations.
Powerful Analytics Made Simple
Chartio delivers on its promise of “Powerful Analytics Made Simple” and they are actively releasing new features. We recommend you give Chartio a spin with a free trial.

About Jeff
Jeff is the Co-Founder & CEO of Wicket, and a passionate advocate and change agent for software solutions available to member-driven organizations. Jeff speaks regularly on the power of modern technology for associations and non-profits and how it can be leveraged to better engage with members and to create operational efficiencies. An outspoken critic of Association Management Software (AMS), Jeff has been working with digital technologies for over 20 years through his work with Industrial, the digital agency he founded in 2000.