Membership Data Visualization

In a previous blog post, I talked about Wicket’s vision to leverage data insights in order to drive business decisions. I introduced the type of questions that we would like to answer for our clients about their membership body.
In a nutshell, we want to answer questions in three broad categories: Composition, Behaviour and Prediction. You start by understanding who your members are, then you want to know how they behave and engage with your organization, and finally you would ideally predict future behaviour such as their likelihood to renew their membership next year.
Wicket has a unique perspective on membership data. We know that our current product implementation does an excellent job of collecting information and can answer all three categories of questions.
This summer, we started a formal Wicket Analytics initiative with the aim to answer some of those questions and eventually get to the prediction goals. In this first phase of our analytics research project, we started with data exploration.
Our goal was to segment information about members, donations, and renewal orders found in Wicket’s database in various ways, trying to find visualizations that would provide meaningful insights into the composition of the membership data.
In the next sections, I discuss our approach for each one of these types of Wicket records and present some sample visualizations.
Member Demographics
In this kind of analysis, we focused on understanding the composition of members across gender, age and location of residency.
The following charts represent sample visualizations that can help answer questions about who the organization’s members are with respect to these demographic indicators.
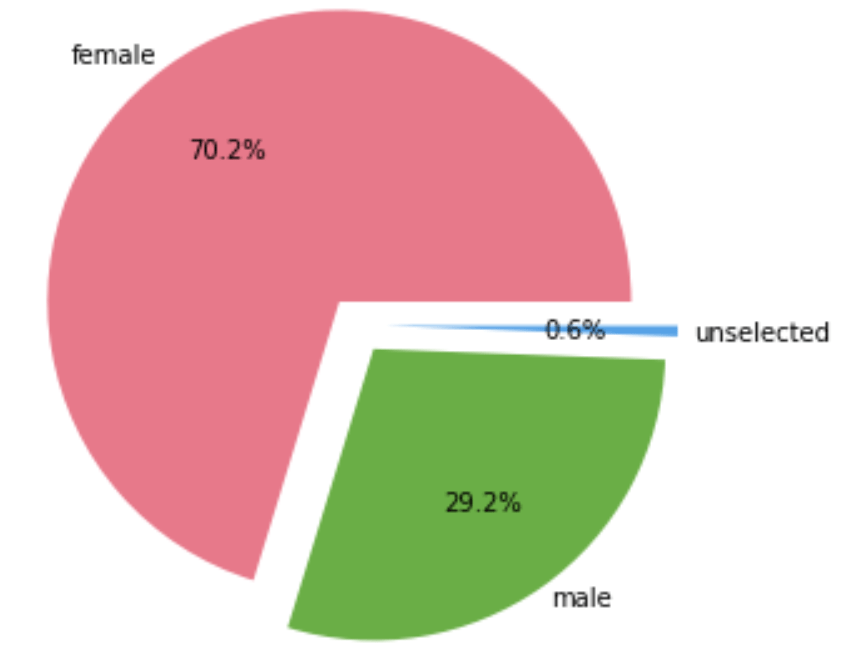
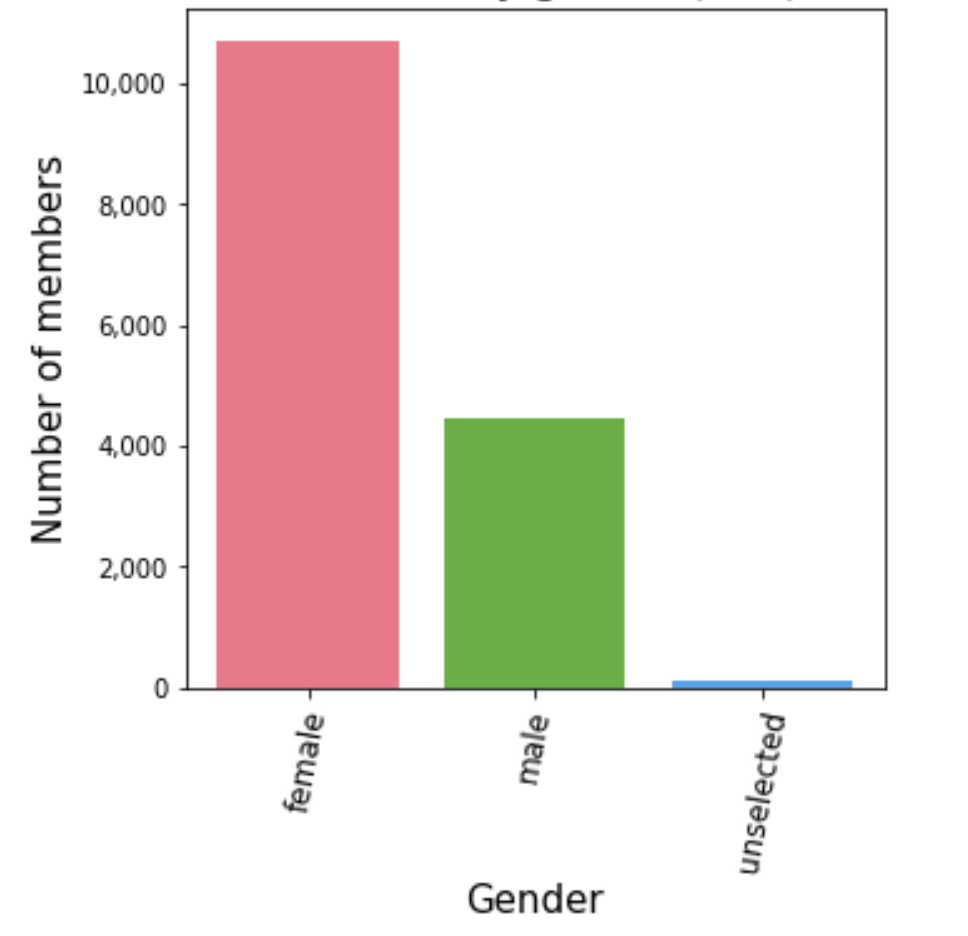
In this sample data, we can clearly see that there is a predominance of females within the membership body. If this information is compared to known statistics of the profession related to this organization, leaders can draw conclusions about the effectiveness of marketing campaigns to penetrate the market by gender.
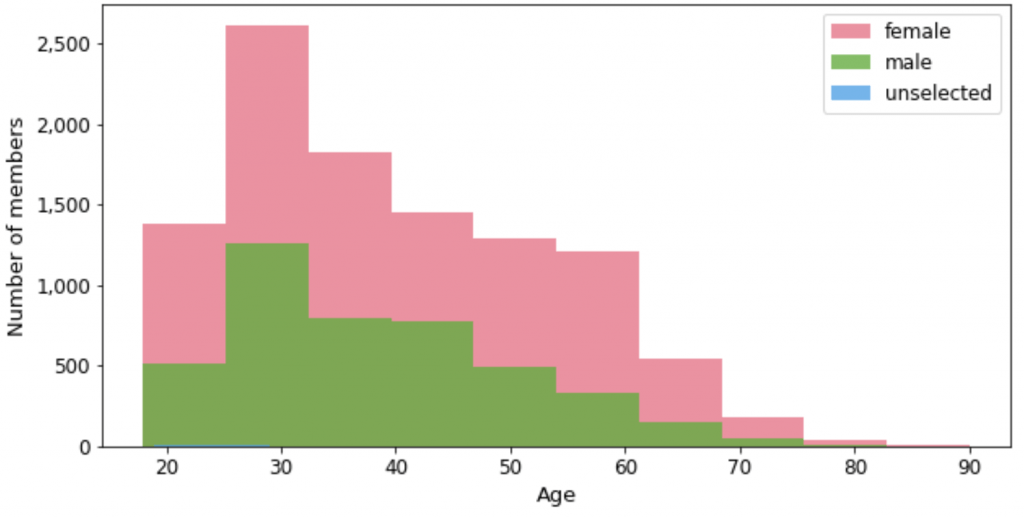
This histogram overlaps the distribution of female and male members across age groups. It can be observed that the majority of the members are between 20 and 40 years old. And both gender groups follow the same distribution even when they differ in the gross counts for each group.
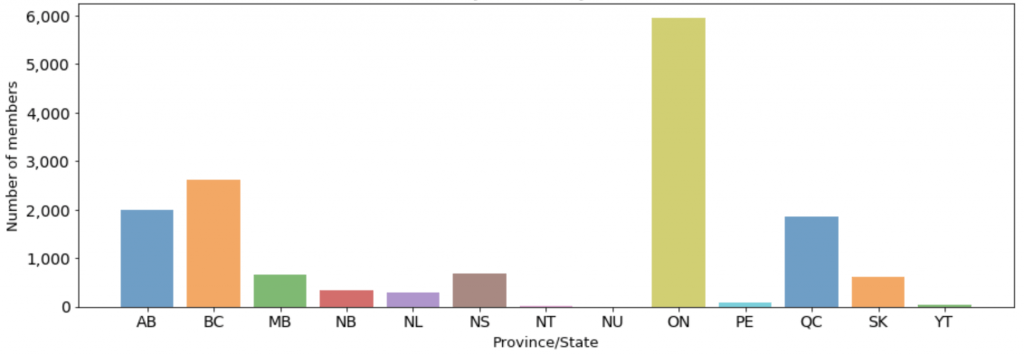
Finally, in this bar chart, we can see how members are distributed geographically according to the Canadian province of their primary address. In this particular example, we can see that the majority of the members are mostly from four provinces, with Ontario being significantly higher. Again, having some stats about the profession would help to assess market penetration for membership in each province.
Other types of visualizations we have explored include demographic information breakdowns by the membership tier, divisions or groups within Wicket. Furthermore, these visualizations can be filtered by the membership season or can be presented as a time series that allow business executives and membership managers to observe trends over time.
Donations
The goal of the donation data exploration was to understand the patterns of donation amounts among membership renewal orders. In Wicket, donations happen at the time of the first-time membership signup or at the time of renewal. So, it is critical to understand how successfully the organization collects donations by amount and by proportion of membership orders.
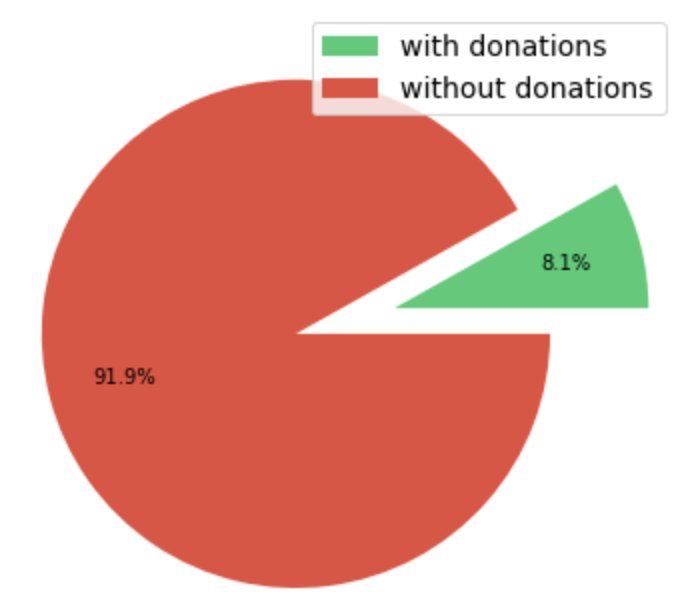
From this sample data, we can see that this organization has collected donations in roughly 8% of all the membership orders processed. Perhaps there would be something that can be done to increase this numbers. Further breakdown and time series visualization could help assess the impact of donation campaigns sent to members.
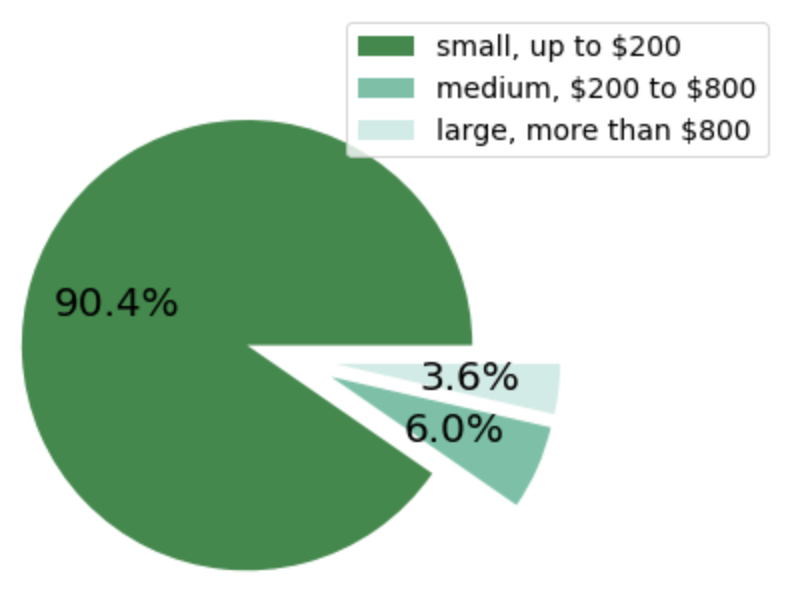
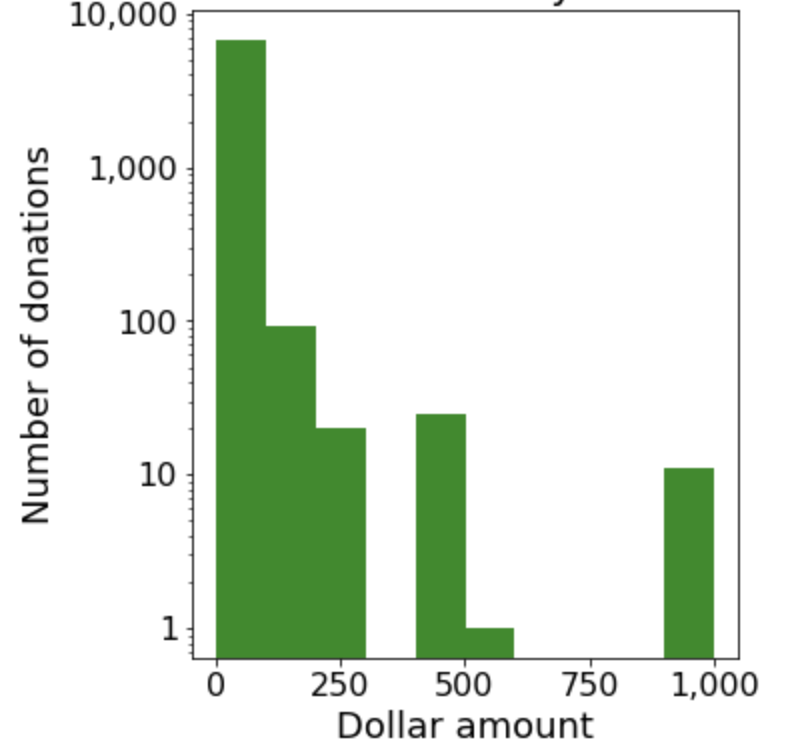
Here we can see the distributions of donation transactions by their relative amount. From the histogram, it can be seen that most of the donations are under 250 dollars, with some additional clusters around the 500 and 1000 marks.
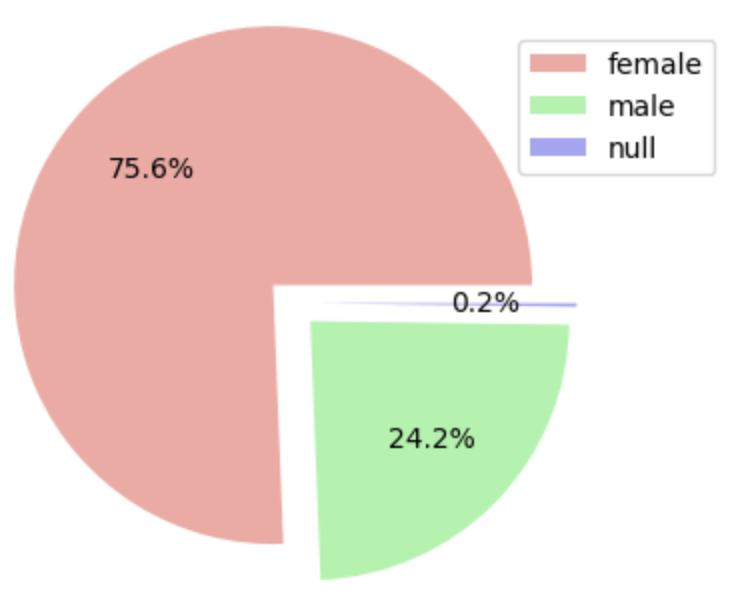
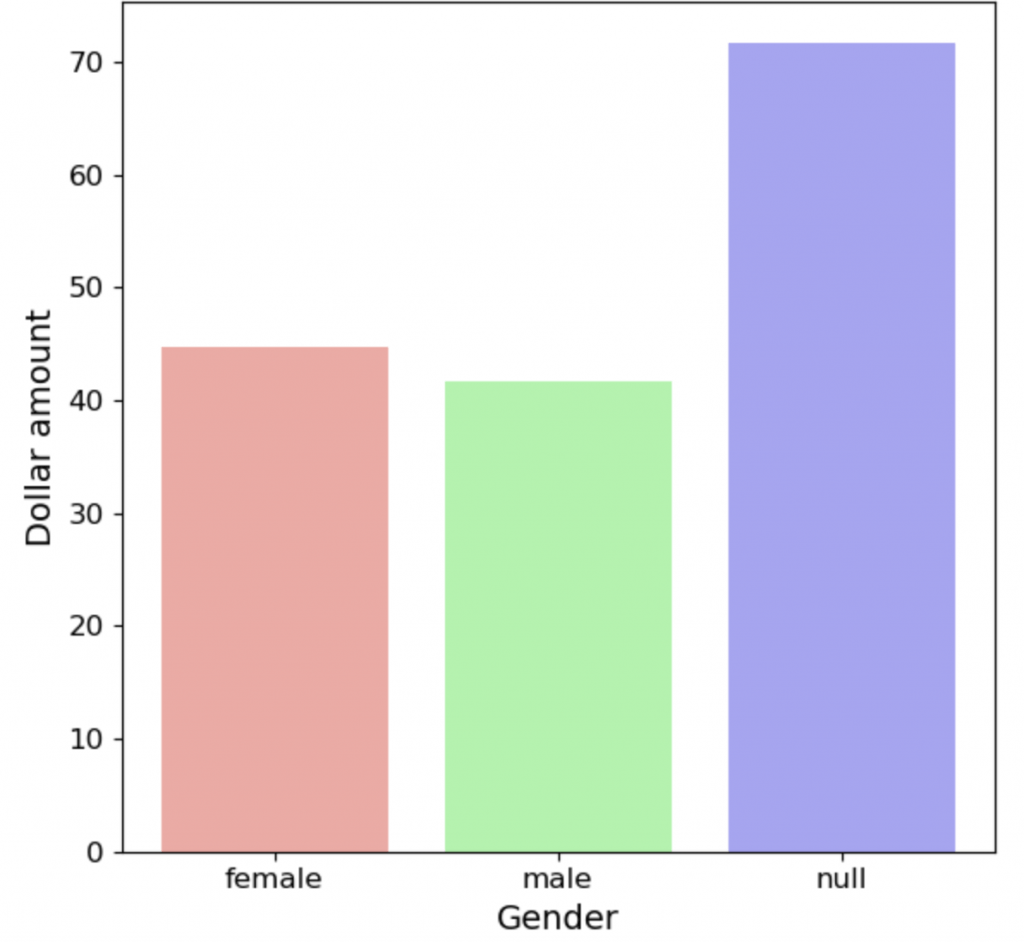
These charts offer further breakdowns of donation percentages and amounts by gender and by province. It can be seen that most received are by women and the average donation amount seems to be consistent between men and women. Interestingly in this example, the average of those whose gender is unknown is significantly higher. This may be a data anomaly that should be further investigated.
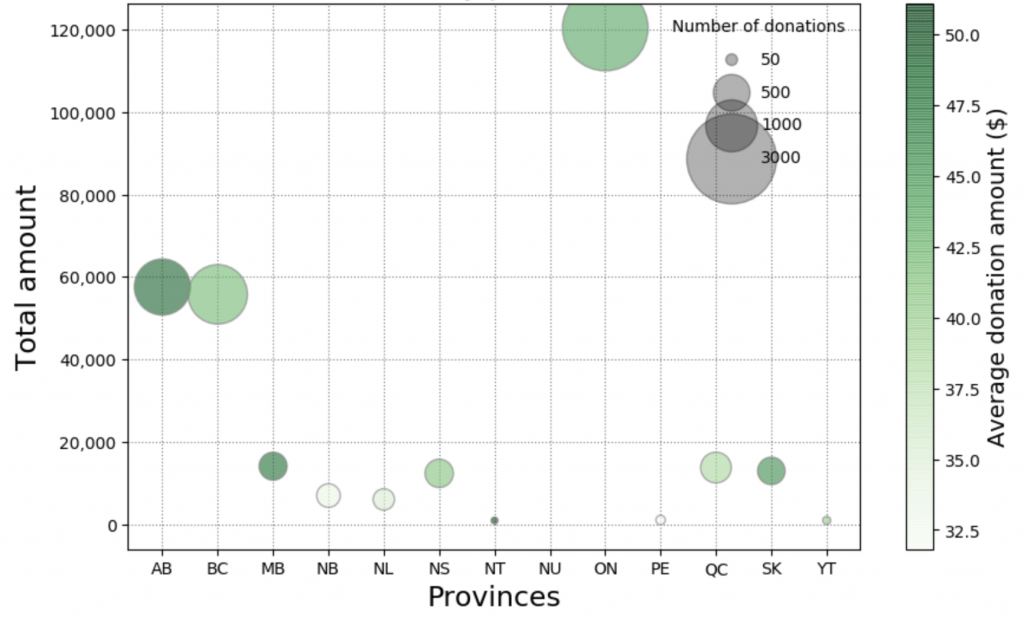
The breakdown by province in this bubble chart provides a lot of information at once. The size of the bubble represents the number of donations by that province, the shade of the bubble is the average size of the donation and the vertical distance is the total donation amount collected for the province.
Renewals
The main goal for the majority of organizations that use Wicket for membership management is to keep members engaged and renewing their membership every year. It is of vital importance to have insights into the numbers around renewal orders.
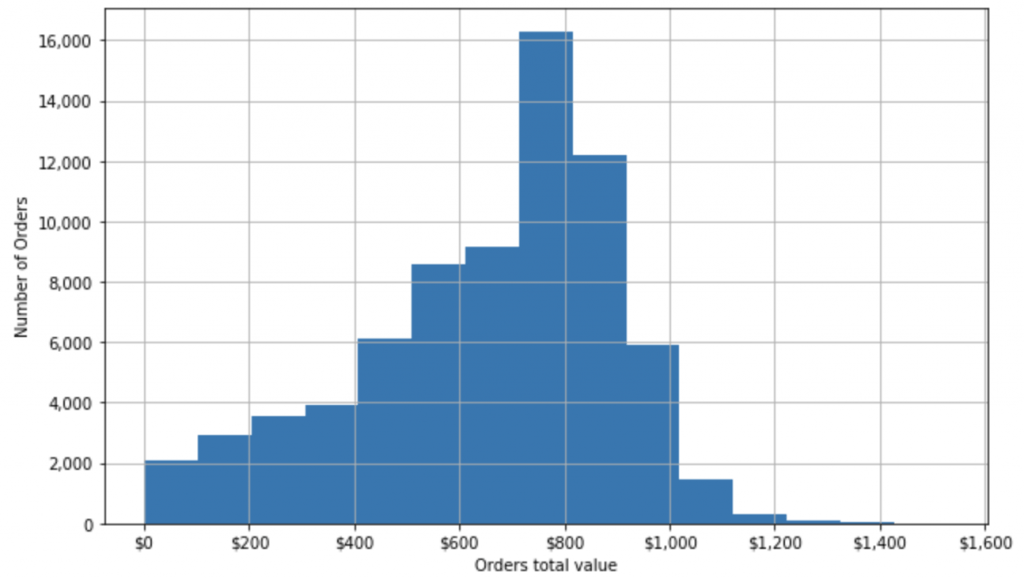
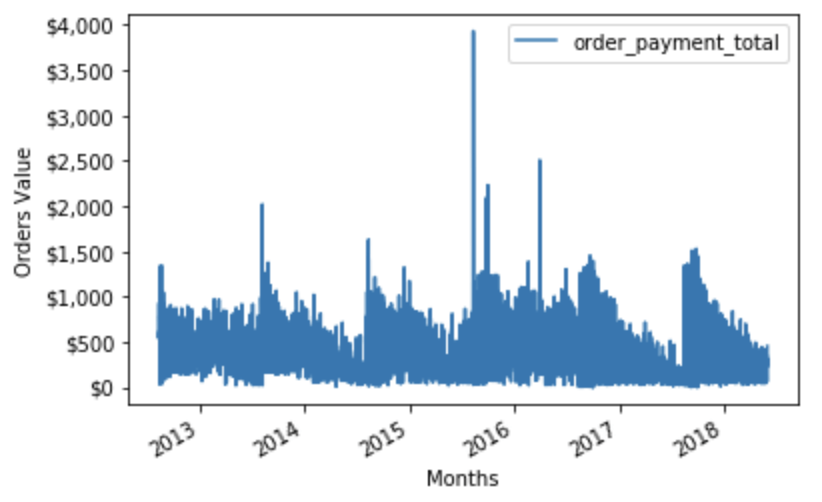
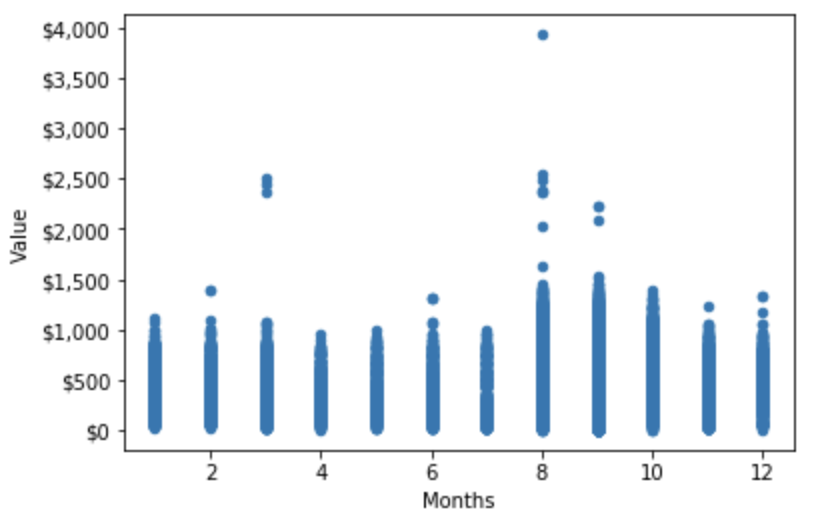
In this example, the distribution of order by their dollar amount can be observed. The histogram shows the normal distribution and the charts below display the yearly and monthly patterns.
Next steps
During this data exploration process, we learned a lot about the patterns of Wicket’s collected data. This information helped us understand trends and discover some areas of opportunity to be able to answer more strategic questions and possibly implement machine learning algorithms that yield prediction outcomes such as those outlined before.
Our next objective is to apply data science techniques to pre-process our data to prepare a dataset that can be fed into a Machine Learning algorithm for training. We will then test and fine-tune the algorithm hyperparameters to improve its prediction accuracy.

About Juan
Juan is the CTO of Wicket. He has over 15 years in the technology field as a developer, technical lead and product manager. He is very passionate about R&D and he is always trying to bring the latest research trends and technologies into engineering operations to deliver quality, usable products and services.